
Dashboard
The administrator dashboard
When you log in to the Whistleblower portal as an administrator, you will be taken directly to your dashboard. The dashboard is your overview of all reports from the accounts you have access to. A Dashboard could look like this:
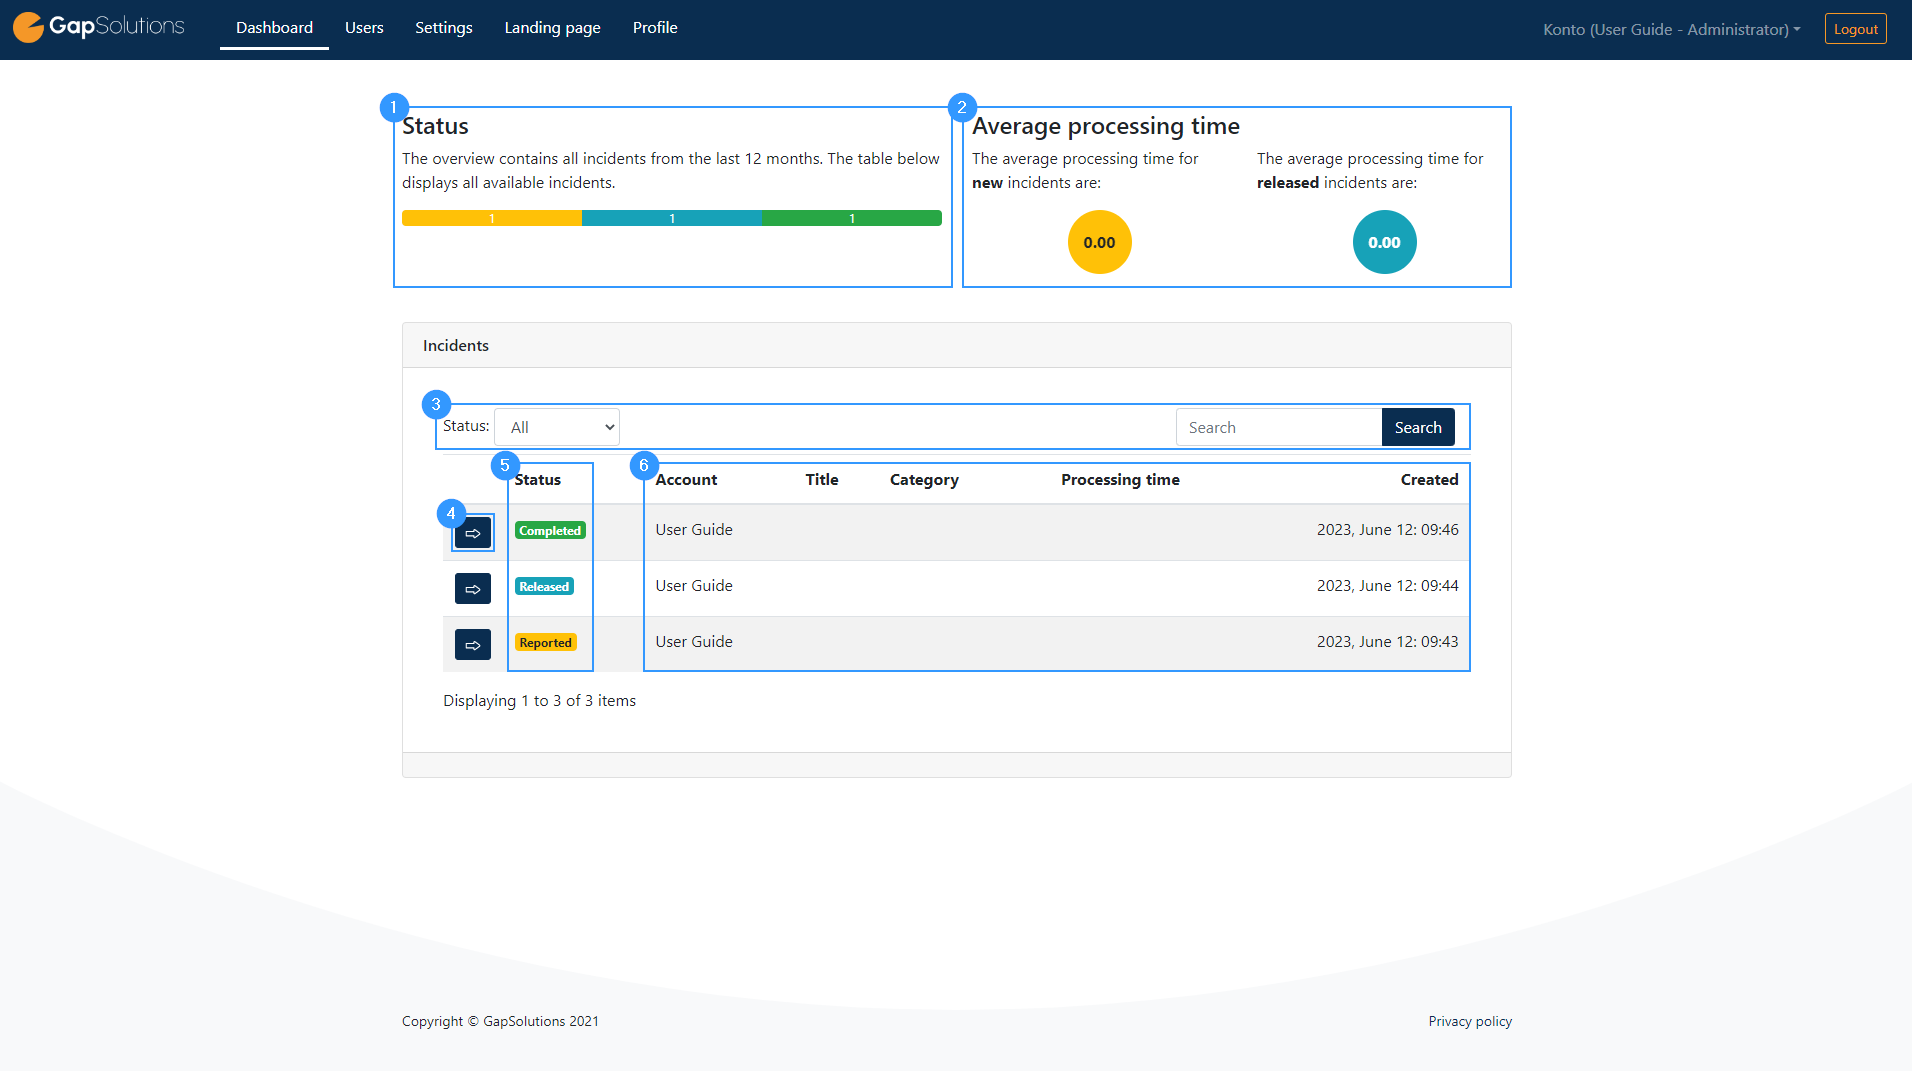
- This gives an overview of the different incidents you have access to. The overview is shown in color, depending on the status of the alerts. The part of the bar that is yellow indicates reports that have been filed but not yet assigned or completed. The blue color indicates that the alert has been released from the screener. The green color indicates that a report has been completed.
- Average processing time indicate the time used on each incident report. The yellow circle indicates the average of how many days that goes by, before an incident is released to an investigator. The blue circle indicates the average number of days from an incident is released to it’s completed.
- Here is an advanced search function. On the left, you can sort the incident reports that appear based on their status. On the right, you can search for specific incident reports.
- When you click here, you will be taken to an overview of the users created in the account to which the report belongs.
- You find the status of the individual report here. The colors indicate the same as in the bar described in point 1.
- The information in this field is regarding each report. Title and category can be assigned to the individual report when the screener/examiner processes the report. It’s not the reporter himself who fills in this information.
Address
GapSolutions A/S
Uraniavej 6, 1.
DK-8700 Horsens
CVR
CVR-nr. 38582356
Phone
Sales & administration
(+45) 8844 0808
Helpline & consultants
(+45) 2199 0808
Cookiepolicy
Privacy policy