Dashboard
How to use the Dashboard
The Dashboard is an overview of the different elements in the portal. The dashboard can be used as a to do list of what needs to be done in order to be compliant, as it gives an overview of gaps and other missing parts such as missing information or overdue inspections, that needs to be handled before the goal of being compliant is achieved.
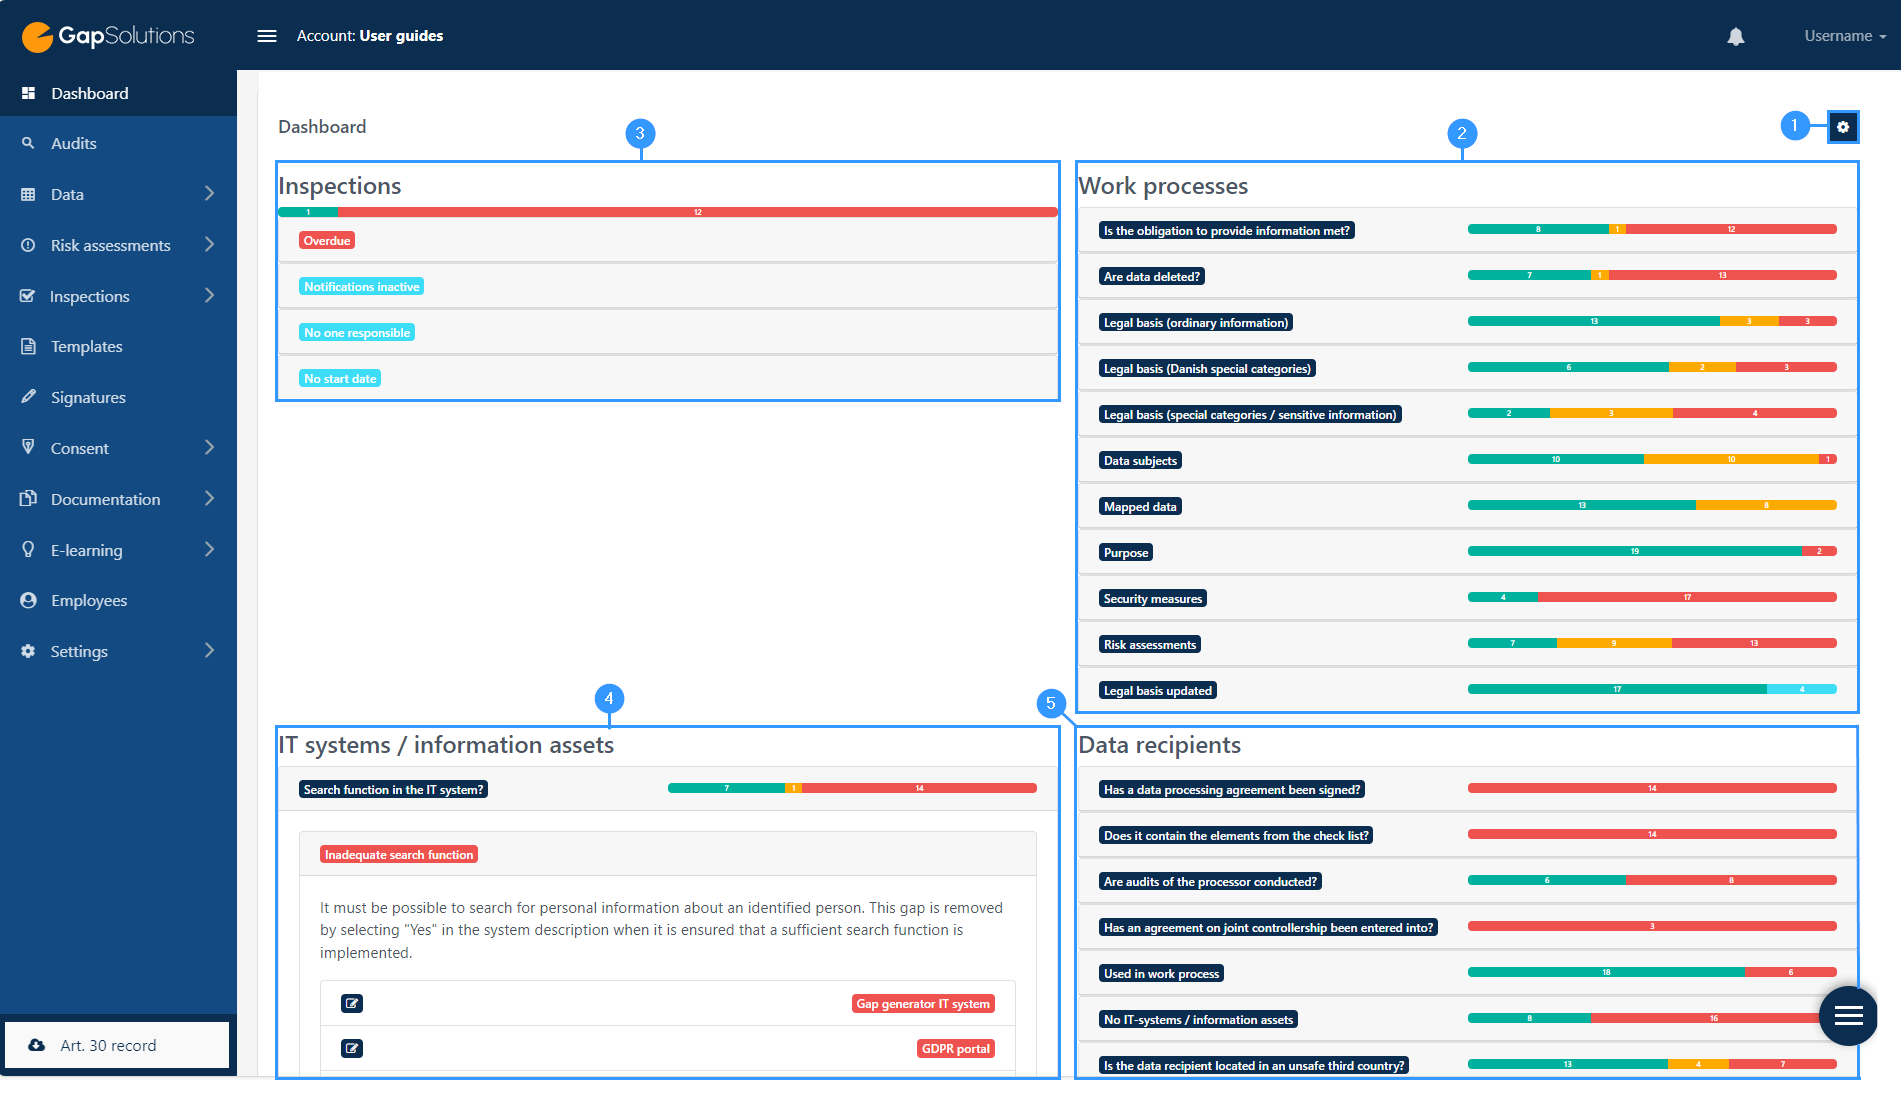
1. Settings: By clicking here, you can edit what information is in your dashboard. Here you can set the following areas: Inspections, Work processes, IT systems / information assets and Data recipients. Next to each area, you can choose whether the dashboard should show non-statutory gaps and whether it should display elements without gaps.
The four areas shown in the dashboard will be briefly described below, and further down the page you will be able to find a more in-depth explanation of the use and significance of the individual areas.
2. Work processes: This is the overview of work processes that is divided into different elements of a work process. Based on each item, you can click to unfold more detailed information. Here you can find out which and how many work processes contain gaps, which in this relation is an expression of informational deficiencies.
3. Inspections: This is the overview of inspections. For more insight, you can click on the bars in the box where they will unfold.
4. IT systems / information assets: This overview, like work processes, is divided into different elements of the IT system / information asset. Based on each element, you can see the status of the individual element and orient yourself in which elements are filled in and which contain gaps, which in this relation is an expression of informational deficiencies.
5. Data recipients: This is the overview of data recipients which is divided into different elements of a data recipient. Based on each item, you can click to unfold more detailed information. Here you can find out which and how many data recipients contain gaps, which in this relation is an expression of informational deficiencies.
Further about settings
When you click on the settings-icon as shown (1) in the image above, you will open the following window:

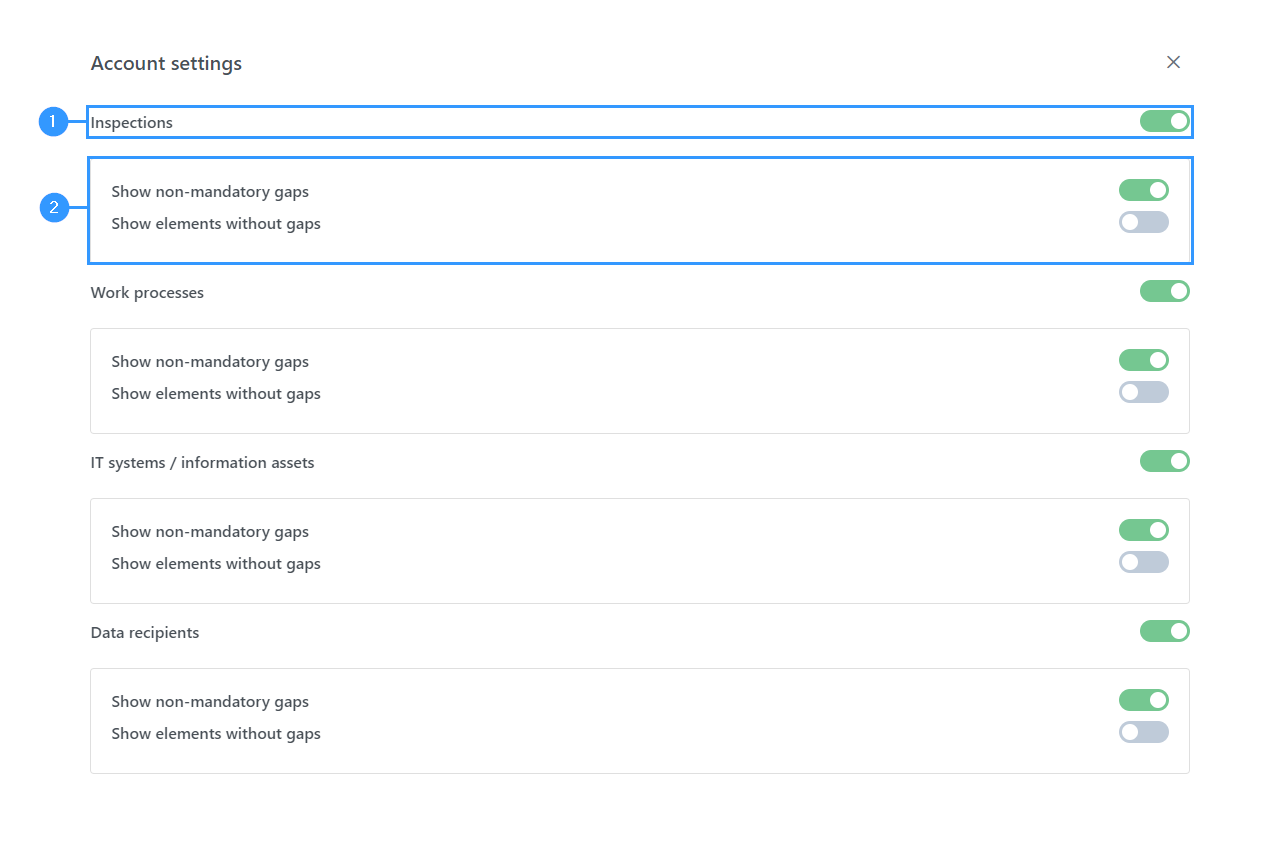
This is where you can choose what should appear on the dashboard. Settings are divided into the four different main points; inspections, work processes, IT systems/information assets and data receivers.
You can choose whether you want to see overviews of the four main points by clicking them on or off on the green icon next to the single item (1).
In addition, you can choose which information you will be able to gain closer insight into from your overview.
(2) This setting will not affect the overview bars with colors but will affect what closer insight you can get into the different elements from the dashboard.
In the reviewed below, the dashboard is set as shown in the image above.
The different areas of the dashboard
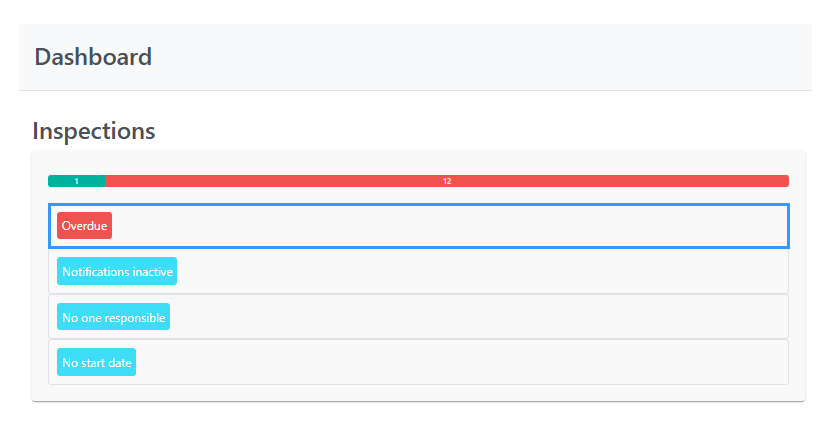
Inspections
If the top bar below inspections shows a red color, it indicates that some inspections have been exceeded. You can get more insight in which inspections are overdue by clicking on the “overdue” bar. This will cause the bar to open an overview of all exceeded inspections. In the overview, you can see both the individual inspection and who is responsible for the inspection.
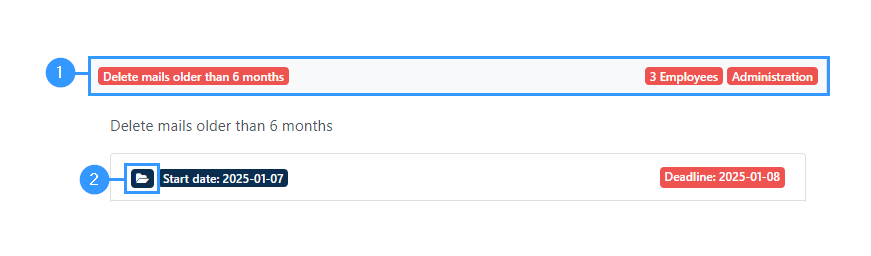
When you click on the individual inspection (1) and then on the folder icon (2). This will open the following window:
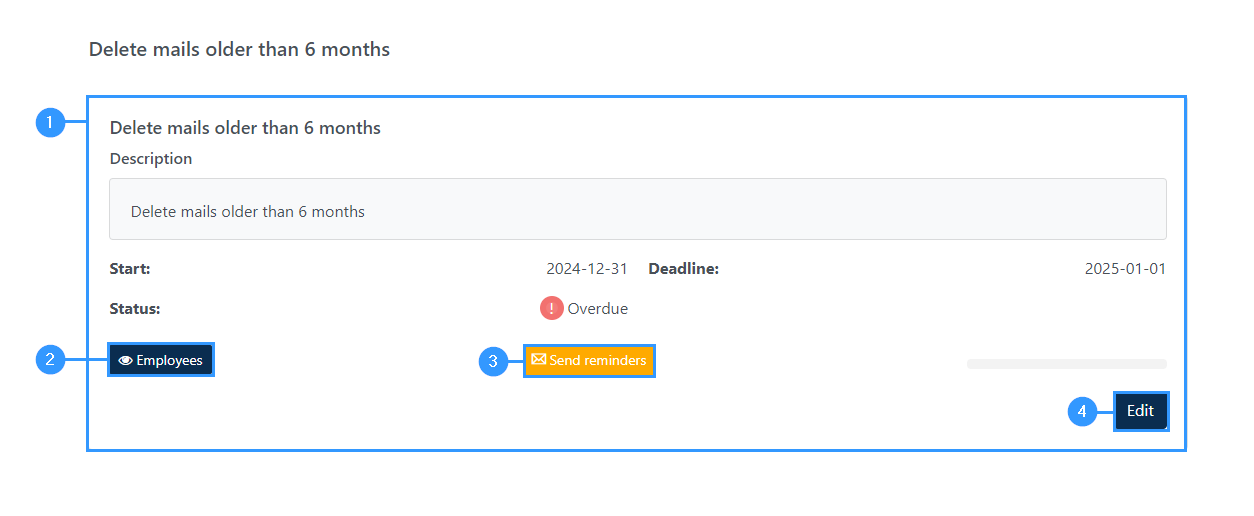
1. Overview
-Information about the individual inspections
2. Employees
-By clicking here, you can see an overview of which employees that are responsible for the inspection.
3. Send reminders
-Here you can send out reminders to employees to complete the inspections. It is also possible to send reminders by clicking on employees in section 2 and choosing which employees the reminder should be sent out to.
4. Edit
-By clicking here, you will be able to attach files.
Work processes
The overview of work processes is divided into the different elements that belong to a work process. The items are consistent with the fields that must be filled in when creating a work process.

1. Work process
-You can click on each bar and get details of the fields that aren’t green and therefore require a decision.
2. Bars of colour
-For each point, you will be able to see a bar that can show red, yellow, green, and blue.
The red fields
-The red fields is an expression of a gap, which means that there is a gap in connection with the work process for it to be in accordance with the legislation in the area. This gap deals with key pieces of information that need to be filled. A red gap in connection with work processes cannot be accepted and requires this to be considered by filling out the work process with the information required.
The yellow fields
-When a gap appears yellow in relation to work processes, it indicates a lack of detail. To understand the difference between yellow and red gaps, the legal basis to be filled in during the work process can be used. If the legal basis is not filled in, it is a key information that is missing and thus a red gap. If there is no justification for the legal basis, it is the level of detail that is insufficient and thus a yellow gap. In relation to work processes, both red and yellow gaps require that the necessary information is created in the work process. In the dashboard, the yellow gap features will work similarly to red, but in the work process, you’ll see them as yellow exclamation marks next to the elements that are causing the gap.
The green fields
-in the bars indicate that the fields are filled in in accordance with the requirements of the legislation for work processes.
The blue fields
-When a bar shows a blue color, it is something to be aware of, but not necessarily a problem in relation to the work process and whether it meets the regulatory requirements. It can be understood as having an informational function.
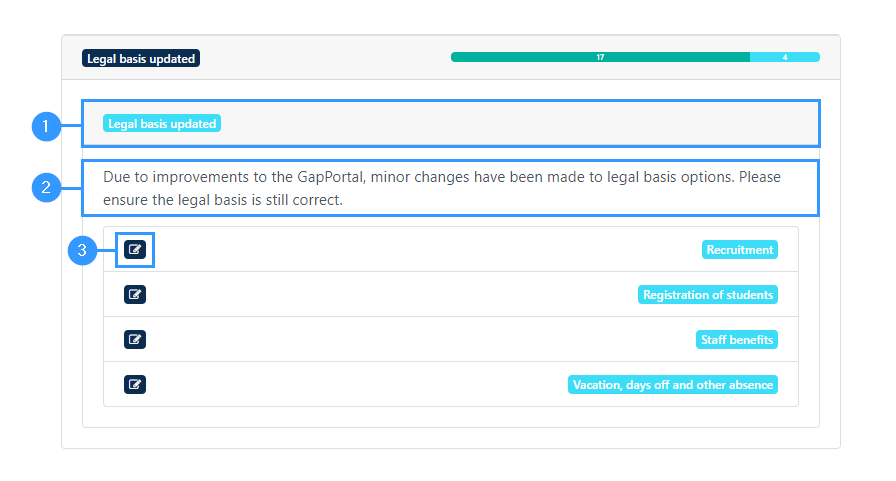
In the example below, you can see that the blue field indicates that an update of legal basis has been made (1) and by clicking on it, a bar unfolds where there is an explanation of why the individual work process is marked in blue (2) and the opportunity to click directly into the work processes that involved (3)
IT systems / information assets
The overview of IT systems / information assets is divided into the various elements that belong to an IT system / information asset. The points are consistent with the fields to be filled in when creating an IT system / information asset.
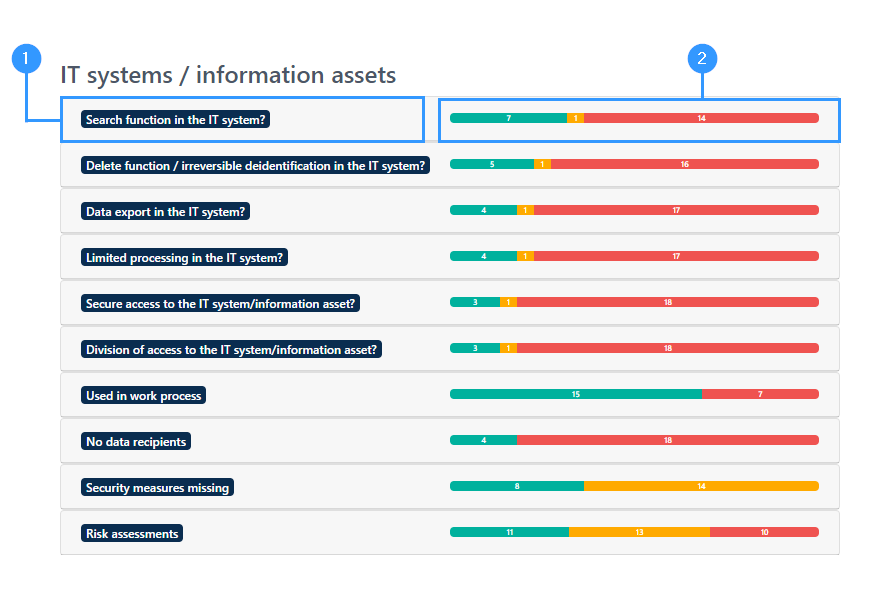
1. IT systems / information assets
-You can click on each bar and get details of the fields that are not green and therefore requires a decision.
2. Bars of colour
-For each point, you will be able to see a bar that can show red, yellow and green.
The red and yellow boxes are expressions of gaps and have the same meaning as mentioned under work processes and are thus elements where information must be provided to comply with the legislation.
The green fields in the bars indicate that the fields are filled in in accordance with the requirements set by the legislation for IT systems / information assets.
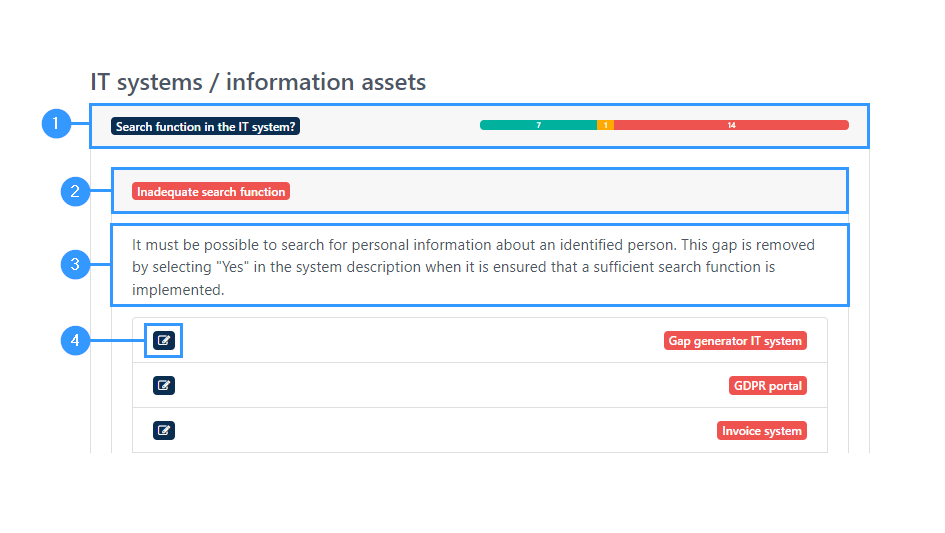
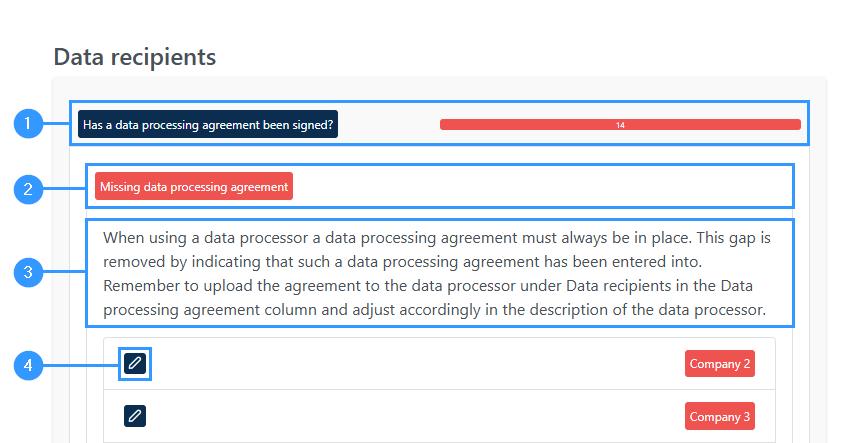
When clicking on a specific bar (1), a subbar will open and the gap will appear marked in red (2) and clicking here opens a closer insight into the individual gap. There will be a justification of the gap and an explanation of how it is removed (3).
Furthermore, it is possible to access the form for an IT system / information asset directly by clicking on the small icon (4) to the left of the specific IT system / information asset.
Data recipients
The overview of data recipients is divided into the different elements relating to data recipients. The points are consistent with the fields that must be filled in when creating a data receiver.
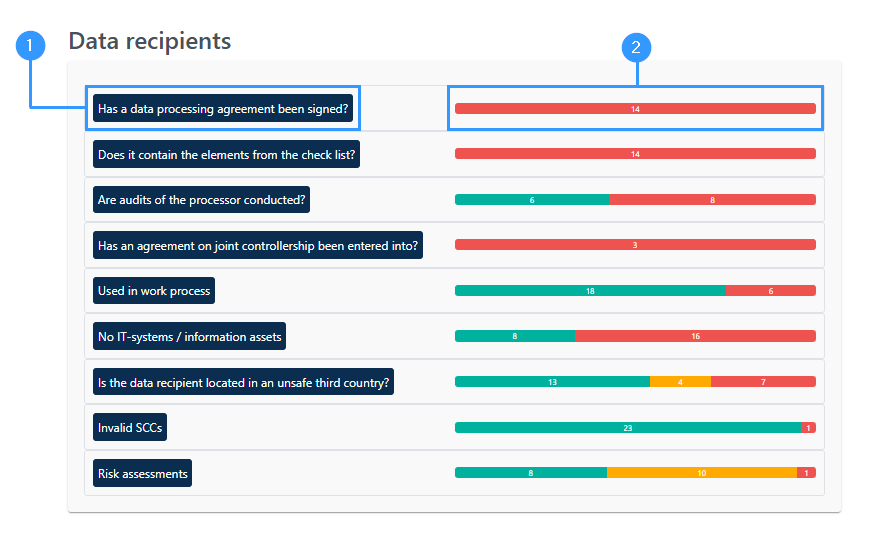
1. Data recipients
-You can click on each bar and get details of the fields that are not green and therefore requires a decision.
2. Bars of colour
-For each point, you will be able to see a bar that can show red, yellow and green.
When clicking on a specific bar (1), a subbar will open and the gap will appear marked in red (2) and clicking here opens a closer insight into the individual gap. There will be a justification of the gap and an explanation of how it is removed (3).
Furthermore, it is possible to access the form for a data recipient directly by clicking on the small pen-icon (4)
Adresse
GapSolutions A/S
Uraniavej 6
DK-8700 Horsens
CVR
CVR-nr. 38582356
Telefon
Salg & administration
(+45) 8844 0808
Helpline & konsulenter
(+45) 2199 0808
E-mail
Kontakt@gapsolutions.dk
Support@gapsolutions.dk
Vi bruger udelukkende tekniske cookies på vores hjemmeside. For yderligere information se vores Cookiepolitik.
Vi er ISO 27001-certificeret og ISAE 3000-auditeret.